What is an asymptotic arrival direction?
We have seen that the direction from which particles that impinge on a given point in the atmosphere of the Earth arrive onto the Magnetosphere depends on the location on the Earth. Cosmic rays with very high energy are not deflected by the Earth's magnetic field. That means that a given neutron monitor will be most sensitive to the very high energy cosmic rays that propagate along a straight line fixed by the latitude and longitude of the geographic position of the neutron monitor. However, particles of lower energy are more strongly deflected. From our schematic drawing we could deduce that a neutron monitor near the Earth's magnetic equator will detect particles whose arrival direction is the more eastward, the lower their energy. The situation is more complex at stations located elsewhere. Using computer codes, one can calculate for each neutron monitor the directions of particles at different energies that will eventually impinge on the atmosphere at the zenith of the station. These asymptotic directions of arrival can then be plotted onto a map for each individual neutron monitor. Since the geomagnetic field at a given place changes in the course of time because of the Earth's rotation with respect to the solar wind, the asymptotic directions of arrival at a given place also change, and must be computed for each instant when a measurement is to be analysed.
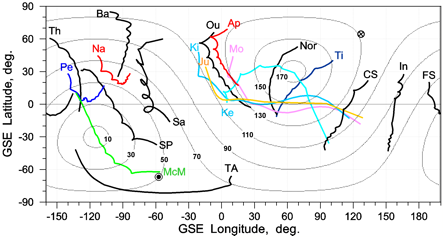
This Figure is a map of asymptotic arrival directions for a set of neutron monitors, determined near 7:00 UT on 20th January 2005. The neutron monitors are indicated by their two-letter abbreviation (Th-Thule, Na-Nain, Bar-Barentsburg, McM-McMurdo, SP-South Pole, Sa-SANAE, Pe-Peawanuk, TA-Terre Adelie, Ou-Oulu, Ap-Apatity, Mo-Moscow, Ki-Kiel, Ju-Jungfrauioch, Ke-Kerguelen, Nor-Norilsk, Ti-Tixie Bay, CS-Cape Shmidt, In-Inuvik). The curve of arrival directions at each neutron monitor comprises the directions for a range of magnetic rigidities or energies. The direction of the highest rigidity for which the calculation was carried out (20 GV, corresponding to a kinetic energy of 19 GeV if the particle is a proton) is at the start of the curve near the station label, the direction of the lowest rigidity (1 GV, corresponding to an energy of 430 MeV) at the other end. We see that each station has a characteristic set of arrival directions. Taken together, these stations allow us to measure how many particles travel in which direction during a solar event.
The closed grid lines overplotted on the map are contours of equal pitch angle which also depicts the particle flux intensity. The highest intensity inferred from the measurements of the solar event on 20th January 2005 occurred in a direction near -115° longitude and -30° latitude, in the lower left corner of the map. Note that the asymptotic directions of the neutron monitors at Mc Murdo (McM), South pole (SP) and Terre Adie (TA) lie close to this point, and that the McMurdo directions even go through it. This reflects the observations: these monitors measured the strongest and fastest increases of the count rate within the worldwide network of neutron monitors.

The asymptotic directions of the neutron monitor at Kerguelen Island, on the other hand, were far from the directions where most particles arrived, and this explains why the count rate was so much lower than, for instance, at Terre Adie. Of course our reasoning here, where we compare the asymptotic arrival directions with the iso-intensity contours of cosmic rays with different arrival directions, is the inverse of the procedure which was actually adopted to identify these arrival directions: it is the fact that the three Antarctic stations register the highest count rate increase that allowed us to derive that most of the solar particles in the initial phase of the event came from the direction (-115°, -30°). One expects that the first particles arriving at Earth travel along the interplanetary magnetic field, and that particles travelling at some angle to the field (along a helical trajectory) will arrive somewhat later, because they travel a longer distance. The direction of the interplanetary magnetic field at the time when the map was computed is given by a fat dot surrounded by a circle, near the McM location. This is close to the actual arrival direction of the bulk of the particles - the difference between the two directions can be easily explained by the simplified model that we assume when deriving the angular distribution of the arrival directions.