Plot GLE71:
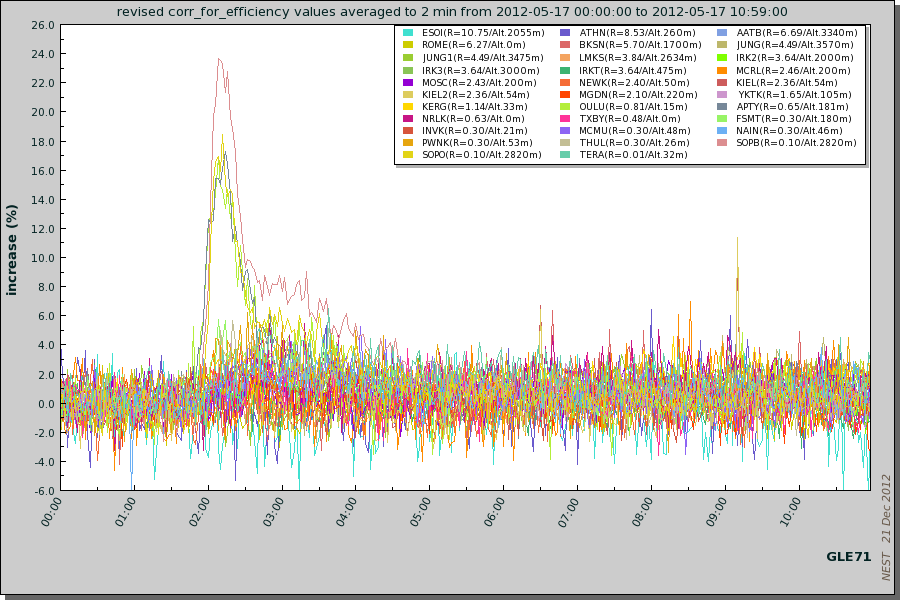
How to get this plot:
- just click on the GLE71 button in the quick plot area
How to get this plot:
- just click on the GLE71 button in the quick plot area
Plot GLE71 (semi customized):
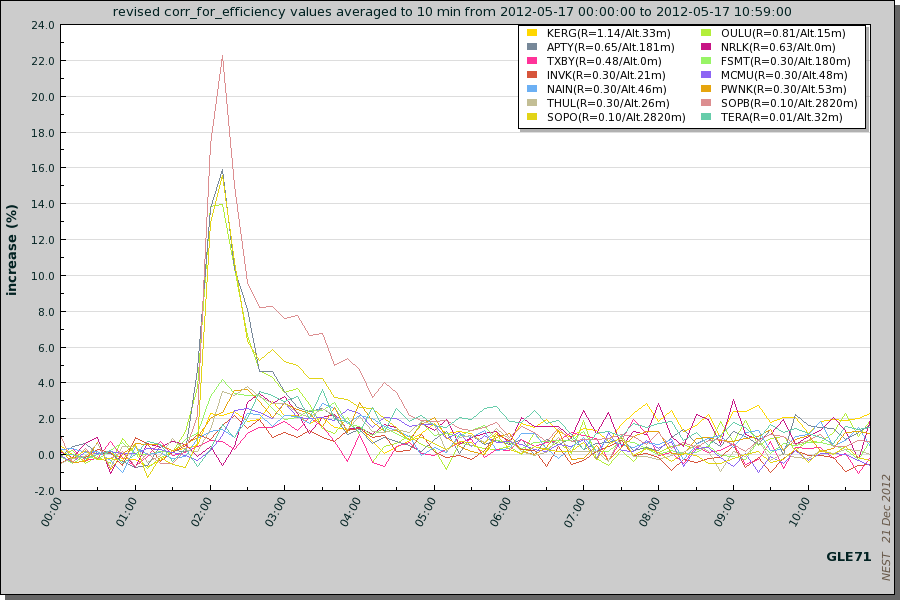
How to get this plot:
- select the stations with rigidity lower than 1.5 in the smart selection area
- select GLE71 in the date selection area
- select 10min in the time resolution area
How to get this plot:
- select the stations with rigidity lower than 1.5 in the smart selection area
- select GLE71 in the date selection area
- select 10min in the time resolution area
Plot GLE71 (fully customized):
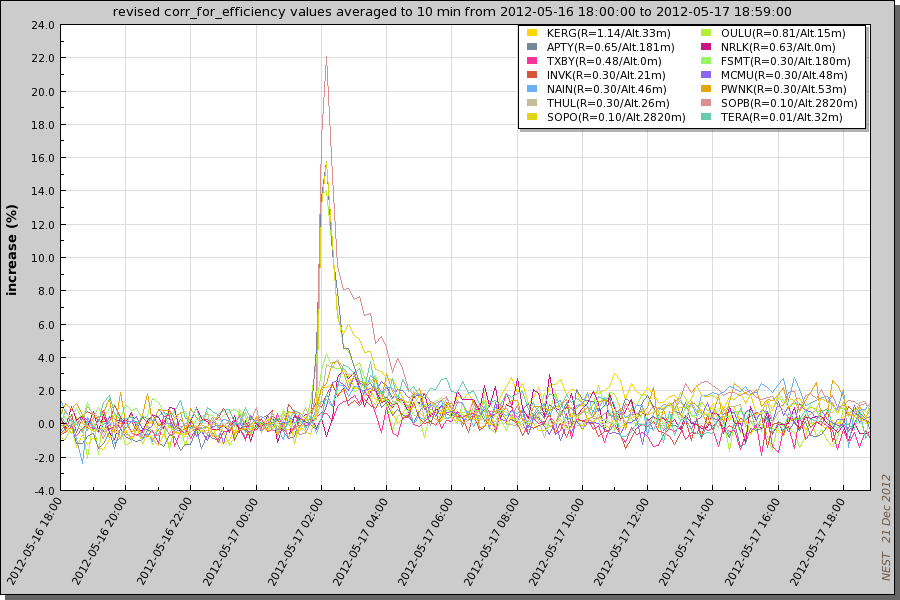
How to get this plot:
- select the stations with rigidity lower than 1.5 in the smart selection area
- select from 16/05/2012 18h00 to 17/05/2012 18h59 in the date selection area
- select 10min in the time resolution area
- select include outliers in the scaling options area
- select interval between time series: 0 in the scaling options area
- select define a baseline interval (17/05/2012 0h00 to 17/05/2012 0h59) in the scaling options area
- select show x axis grid in the style options area
Go further by changing colors of the time series, colors of the background or even of the text...
Plot FD (18/02/2011):
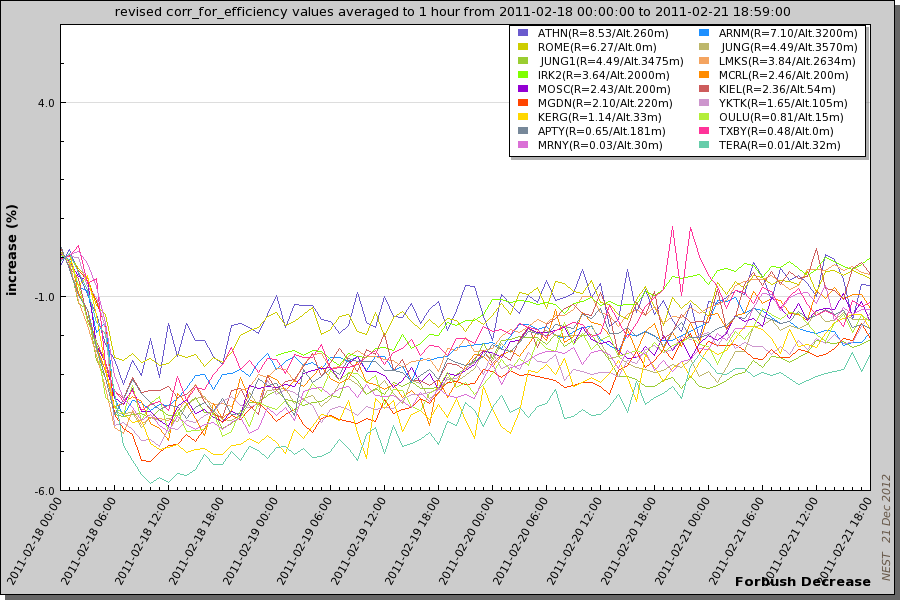
How to get this plot:
- select some stations
- select FD number 53 in the date selection area
- select 1h in the time resolution area
- select specify your own Y axis scale: -6 to 6 in the scaling options area
How to get this plot:
- select some stations
- select FD number 53 in the date selection area
- select 1h in the time resolution area
- select specify your own Y axis scale: -6 to 6 in the scaling options area