Plot online high rigidity stations for the last 2 days and get the ascii values with the best resolution
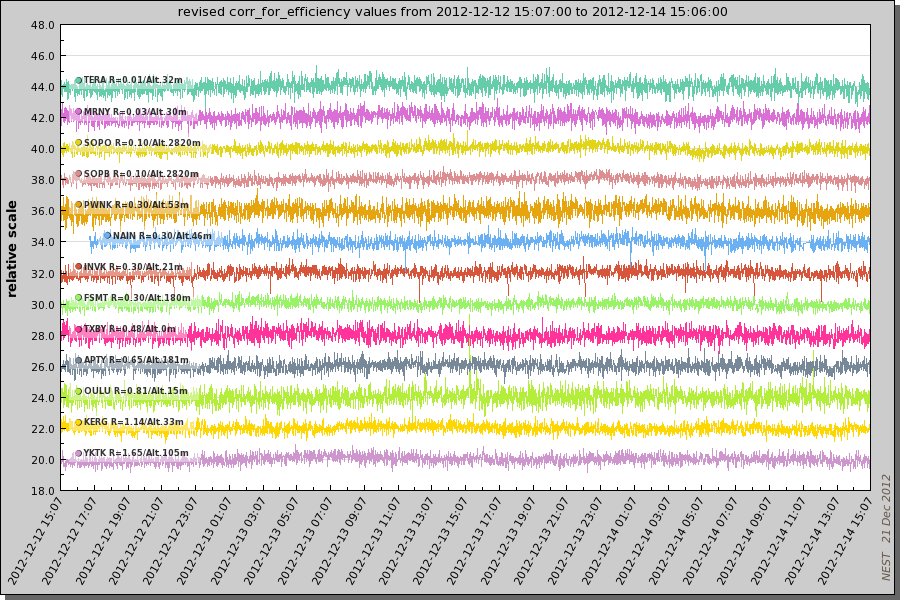
How to get this plot:
- select online stations in the smart selection area
- select rigidity in the smart selection area
- select last 2 days in the date selection area
- select best in the time resolution area and force optionaly
- select plot and ascii in the output area
To display the ascii file, click ascii button on the resulting page:
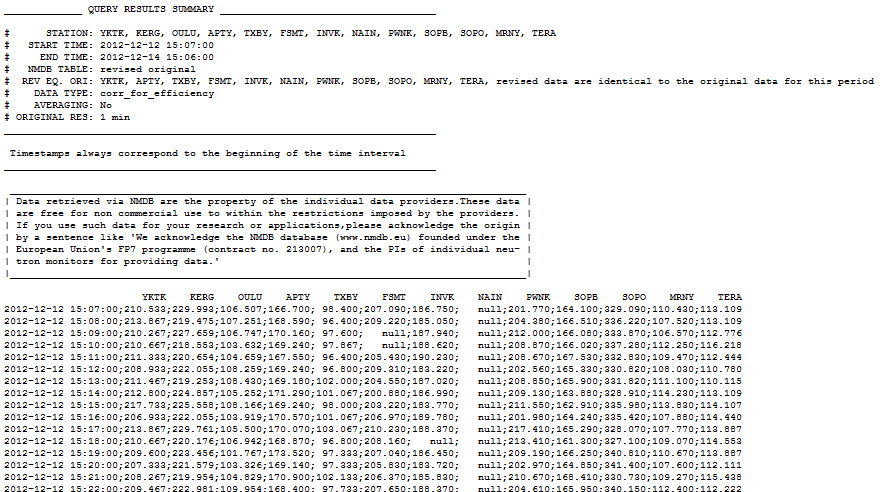